Model Dynamic Interaction Features
To better visualize the influence relationships between various nodes in a model, REVIVE offers a powerful dynamic interaction feature designed to help users gain a deeper understanding of model behavior and interactions between nodes. Users can easily initiate this feature in a browser via a URL, similar to TensorBoard.
Key Features
Dynamic Model Visualization: REVIVE allows users to observe the influence relationships between model nodes in real-time, facilitating quick identification and analysis of model behavior.
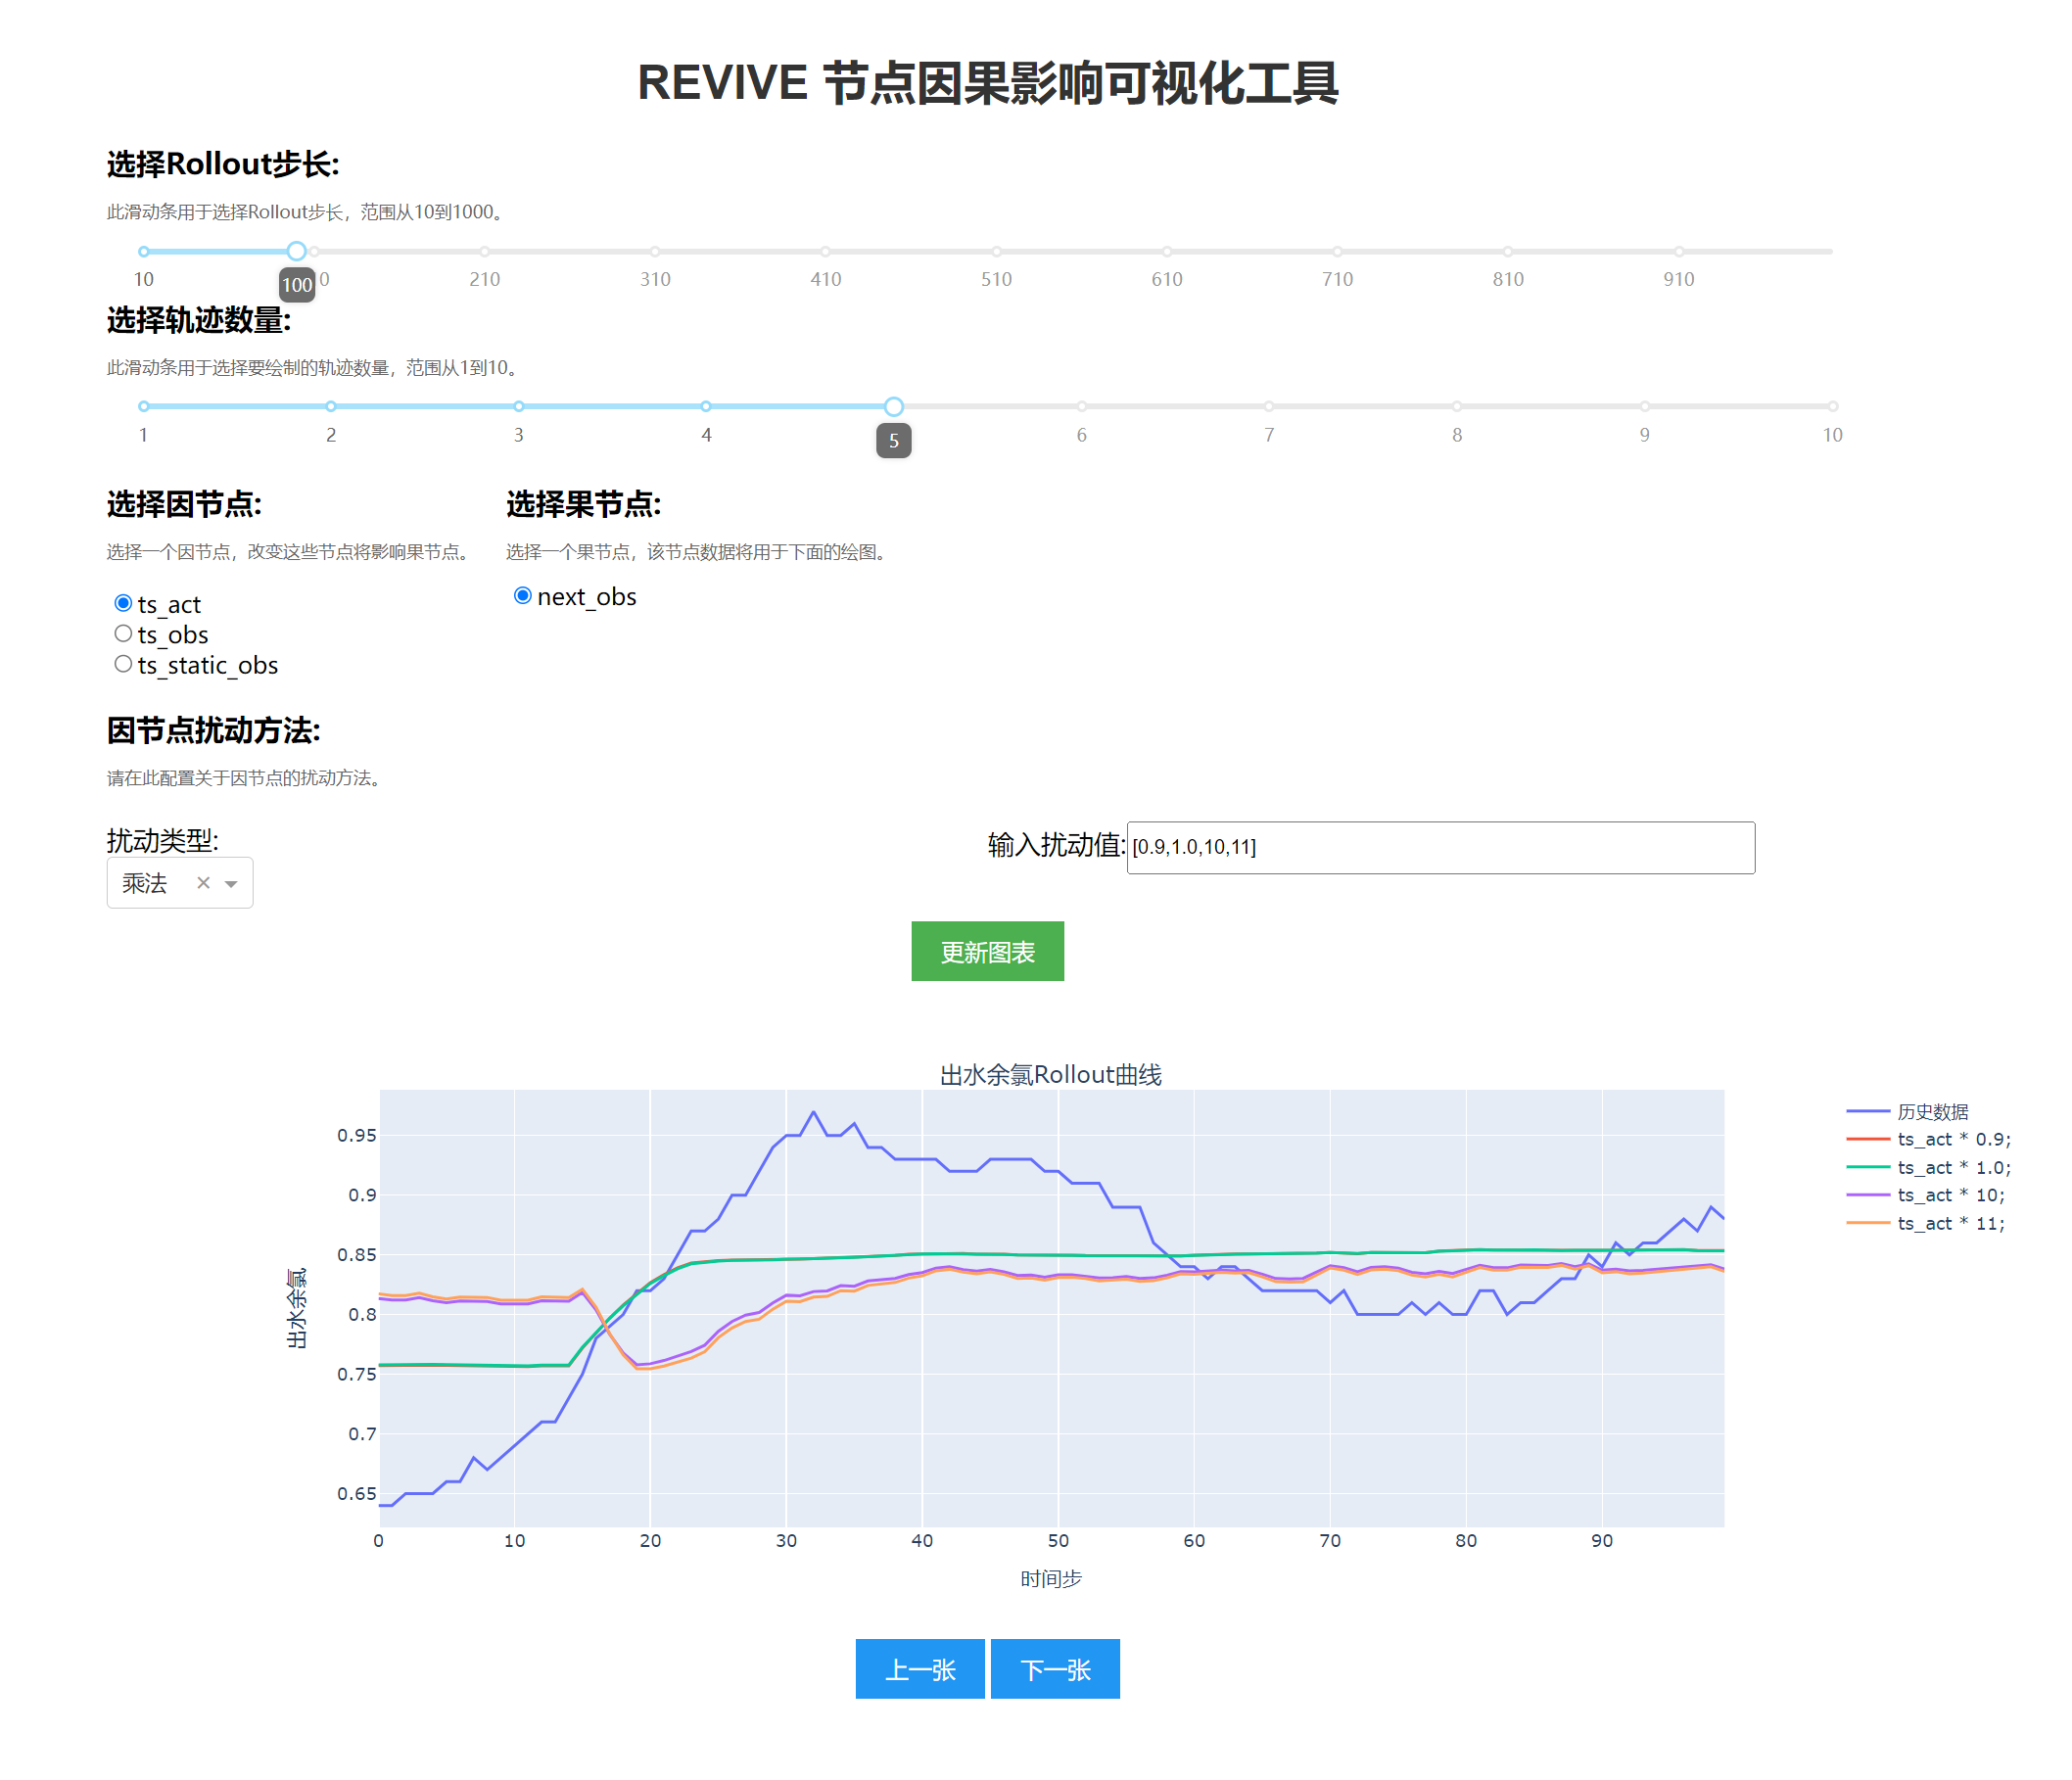
Flexible Configuration Parameters: - Rollout Length: Users can set the simulation time length as needed to observe dynamic changes over different time ranges. - Number of Trajectories per Rollout: The system supports switching between multiple trajectories for comparative analysis. Users can easily browse different trajectories using “Previous” and “Next” buttons to quickly capture important information.
Definition of Cause and Effect Nodes: Users can define cause nodes (typically controllable action nodes) and effect nodes (observation nodes related to control objectives). By perturbing the cause nodes, users can analyze their impact on the effect nodes. This setup allows users to better understand the key factors in the decision-making process.
Types of Perturbations and Their Applications
Additive and Multiplicative Perturbations: REVIVE supports various perturbation types, including additive and multiplicative perturbations. Users can customize lists of perturbation values based on experimental needs, allowing for flexible adjustments to the input data of cause nodes.
By adding or multiplying the defined perturbation values with the original cause node data, users can clearly display the changes in effect nodes across different dimensions under various cause node perturbations in the same chart. This intuitive presentation aids in identifying the model’s sensitivity and response patterns to different input conditions.
Usage Example
After training the environmental model using REVIVE, navigate to the directory where the model is located, for example: ~/logs/revive/venv_train/, and use the following command to start the dynamic interaction panel:
$ revive rollout
Once started, the command line will display the corresponding URL. Accessing this URL in a browser will open the model dynamic interaction panel. The following image shows a visualization panel for a task.
Application Scenarios
Causal Analysis: By systematically perturbing cause nodes, users can analyze the causal relationships between model nodes.
Decision Support: In complex decision-making scenarios, users can quickly assess the potential impacts of different decision actions on the model using visualization tools.
Temporal Impact Analysis: In tasks with delay characteristics, users can analyze the effects of causal relationships over time using visualization tools.
With these features, REVIVE not only enhances visualization effectiveness but also significantly improves user interaction experience, making model analysis more intuitive and efficient.