Data Feature Relationship Analysis and Visualization [Beta]
In the fields of data science and machine learning, understanding the relationships between features is essential for building efficient and accurate models. To help users deeply analyze and comprehend the interactions between data features, REVIVE offers a feature relationship analysis function that supports users in analyzing and visualizing the relationships between features.
Usage
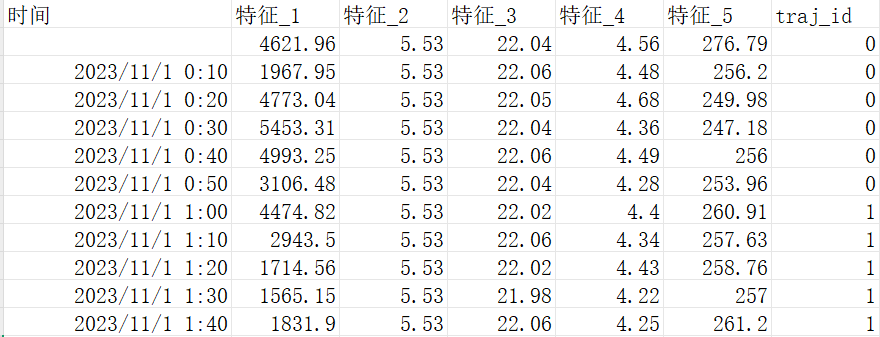
1. Data Organization
To use REVIVE’s feature analysis functionality, users must first organize their data in CSV format. If the data includes multiple trajectories, please use traj_id to identify different trajectories. You can refer to the sample file in revive/examples/functions/feature/data/feature.csv.
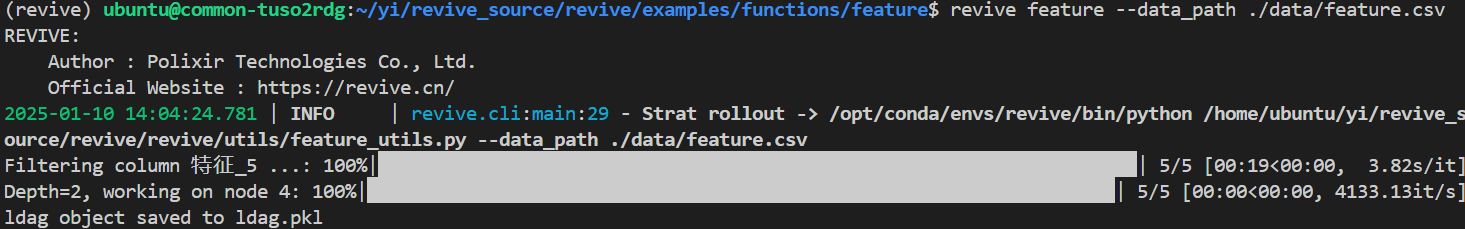
2. Feature Analysis
Use the revive feature command to perform feature relationship analysis. Depending on the volume of data, the analysis process may take anywhere from a few minutes to several hours. Once the analysis is complete, the results will be serialized into the ldag.pkl file.
$ revive feature
3. Feature Relationship Visualization
Use the revive feature_plot command to visualize the feature analysis results.
$ revive feature_plot
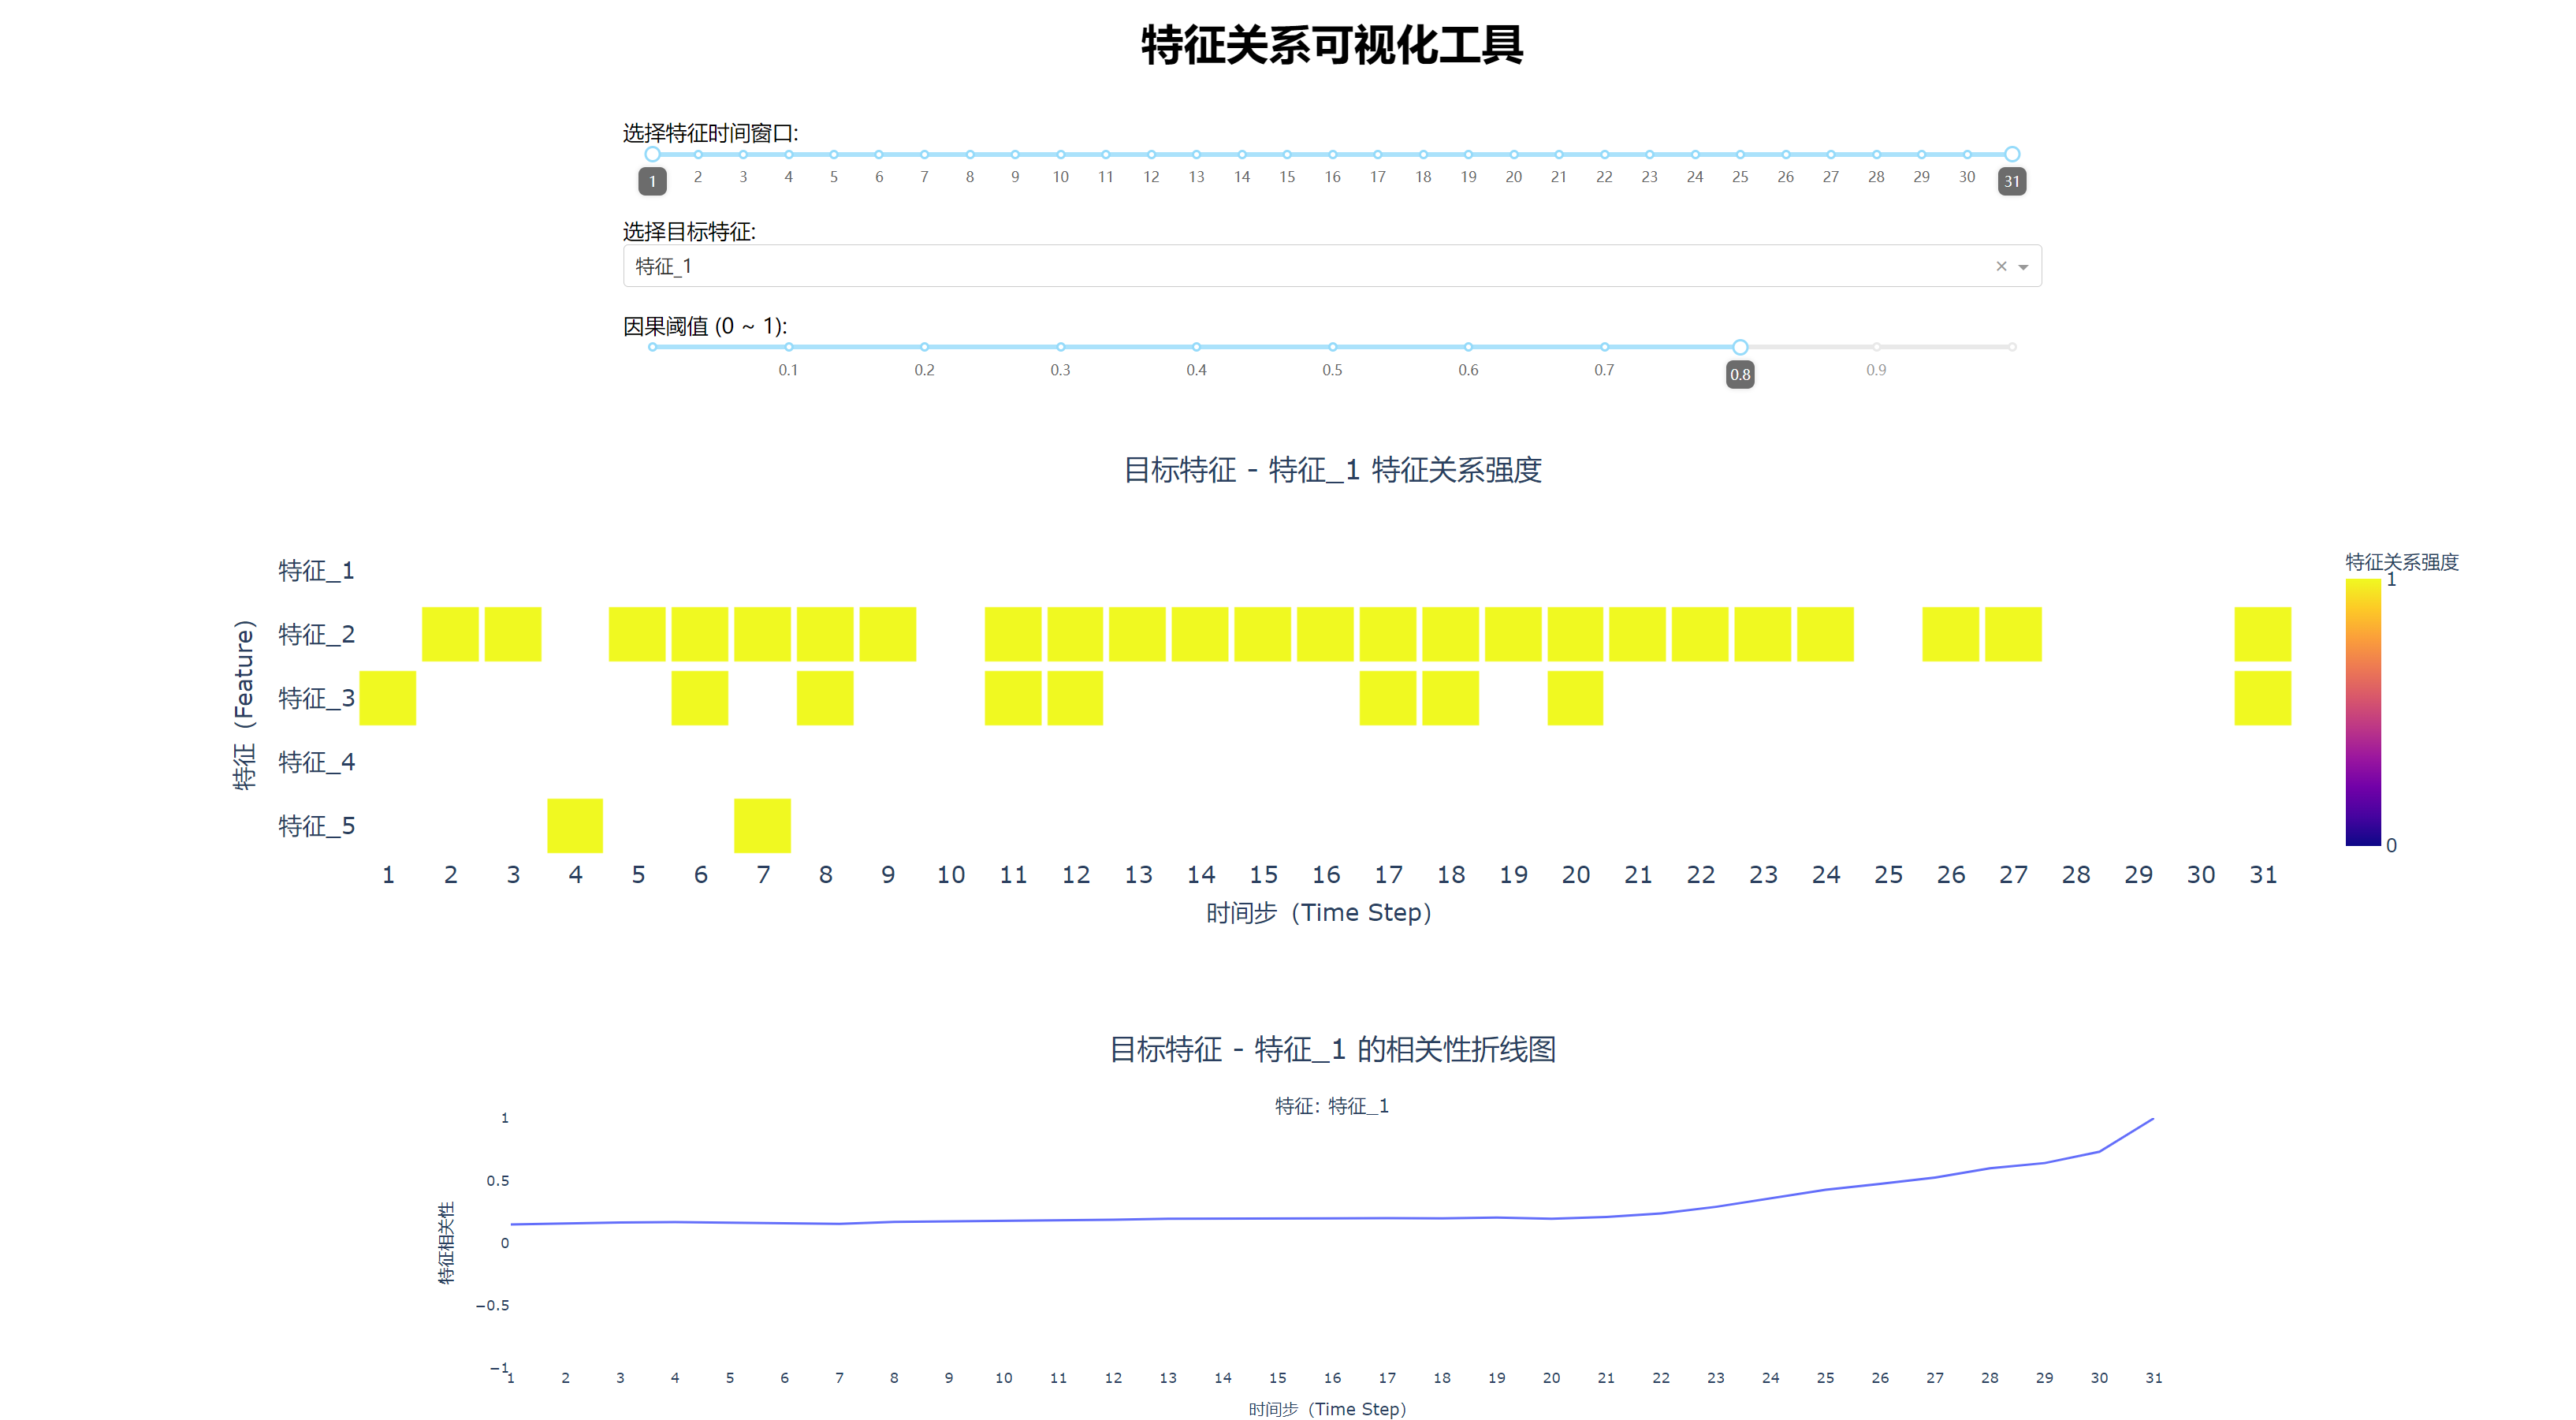
After completing the above steps, you will obtain visual charts of feature relationships, which will help you better understand the interactions between data features, thereby optimizing model construction.