Use REVIVE to control your refrigerator
Introduction to Refrigerator Temperature Control System
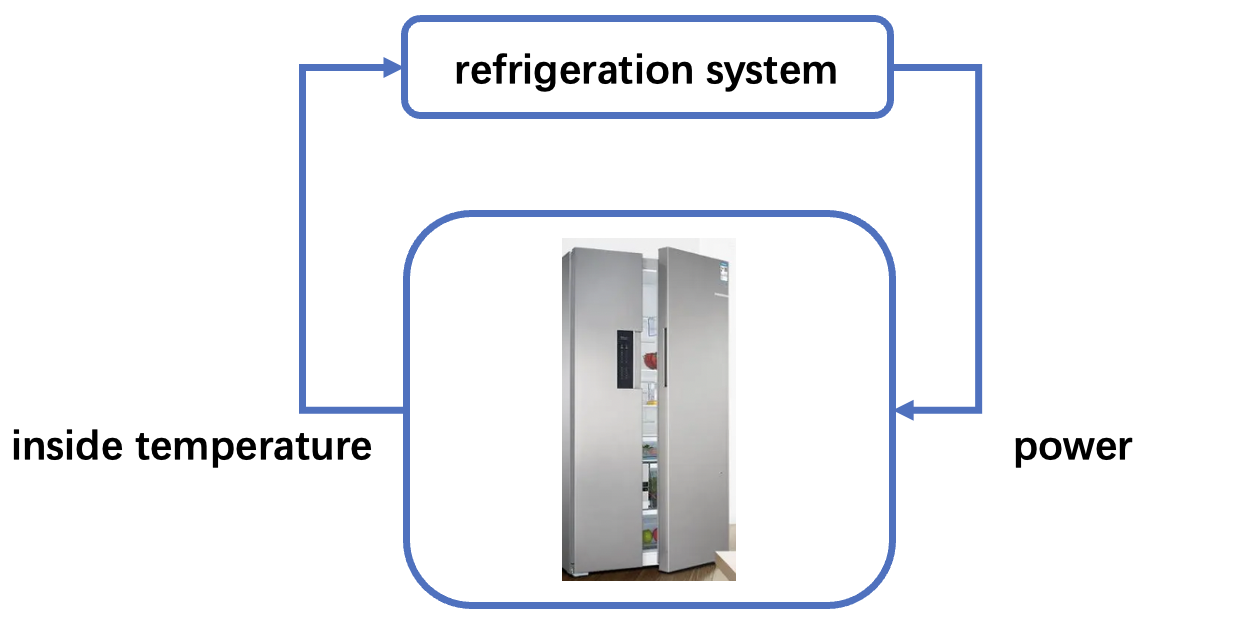
Assuming we need a temperature control system to regulate the refrigerator’s temperature to an ideal target temperature (set to -2°C in the example below) for better food preservation. As shown in the diagram below, the refrigerator control system adjusts the temperature by controlling the electrical power. The higher the electrical power, the stronger the cooling effect, and the lower the electrical power, the weaker the cooling effect. It should be noted that due to the current temperature control system’s (PID control strategy) unstable control effect and the occasional opening of the refrigerator door, resulting in significant fluctuations in the refrigerator’s temperature near the target temperature, we hope to improve the current system’s temperature control strategy and improve the refrigerator’s temperature control effect.
Introduction to Historical Data
In the aforementioned refrigerator temperature control system, we can observe data such as the temperature
inside the refrigerator, the current electrical power usage of the refrigerator, and the open/close status
of the refrigerator door. In the collected historical data, there are four columns of data: door_open (refrigerator
door open/close status, 1 for open and 0 for closed), temperature (the temperature inside the
refrigerator), action (electrical power usage), and next_temperature (the temperature inside the
refrigerator at the next moment).
Current PID Control Policy
PID control is a common temperature control policy that adjusts the temperature based on three aspects: proportional, integral, and derivative. The PID controller measures the difference (known as error) between the current temperature of the refrigerator and the preset temperature, and converts this error into an output signal to control the electrical power usage to adjust the temperature.
Task Objectives
The objective of the control policy is to make the temperature inside the refrigerator as close as possible to the target temperature (set to -2°C in the following example).
Train refrigerator temperature control policy using REVIVE SDK
REVIVE SDK is a historical data-driven tool. According to the documentation, using REVIVE SDK for refrigerator task can be divided into the following steps:
Collect historical decision-making data of refrigerator task.
Combine business scenarios and collected historical data to construct decision flow chart and array data where the decision flow chart primarily describes the interactive logic of business data, stored in
.yamlfile, and array data stores the node data defined in the decision flow chart, stored in.npzor.h5file.With the aforementioned decision flow chart and array data, REVIVE SDK can conduct training of virtual environmental models. However, to obtain a better control strategy, it is necessary to define the reward function according to task objectives (reward function definition). The reward function defines the optimization objective of the strategy, which can guide the control strategy to better control the temperature within the refrigerator close to the ideal temperature.
After defining the decision flow chart, training data, and reward function, we can use REVIVE SDK to begin training virtual environment models and policy models.
Finally, test the policy model trained by REVIVE SDK online.
Collecting Historical Data
We first use the PID strategy to control the refrigerator in a simulated environment, obtaining historical control data.
In the collected historical data, there are four columns of data: door_open (refrigerator door open/close status, where 1
means open and 0 means closed), temperature (the temperature inside the refrigerator), action (power consumption), and
next_temperature (the temperature inside the refrigerator for the next time step).
Defining Decision Flow Graph and Preparing Data
After completing the historical data collection, we need to build a decision flow graph and array data based on the business scenario of refrigerator temperature control. The decision flow graph accurately defines the causal relationship between the data.
In the refrigerator temperature control system, four data nodes can be divided, namely door_open (refrigerator door switch
status), temperature (internal temperature of the refrigerator), action (electric power consumption),
and next_temperature (temperature inside the refrigerator at the next moment).
Based on common sense and physical principles, we can infer the following causal relationships:
When the refrigerator door is opened, external air will enter the interior of the refrigerator, causing the temperature to rise.
There is a causality between the internal temperature of the refrigerator and the temperature at the next moment, and the current temperature will affect the temperature at the next moment.
The size of the electric power consumption is related to the efficiency of the refrigerator cooling and will affect the temperature at the next moment.
The refrigerator’s temperature control strategy can only be adjusted based on the current temperature and cannot sense the refrigerator door switch status (external variable) and the temperature at the next moment (future variable).
According to the logical description of the refrigerator temperature control business above, the decision flow graph can be defined as follows:
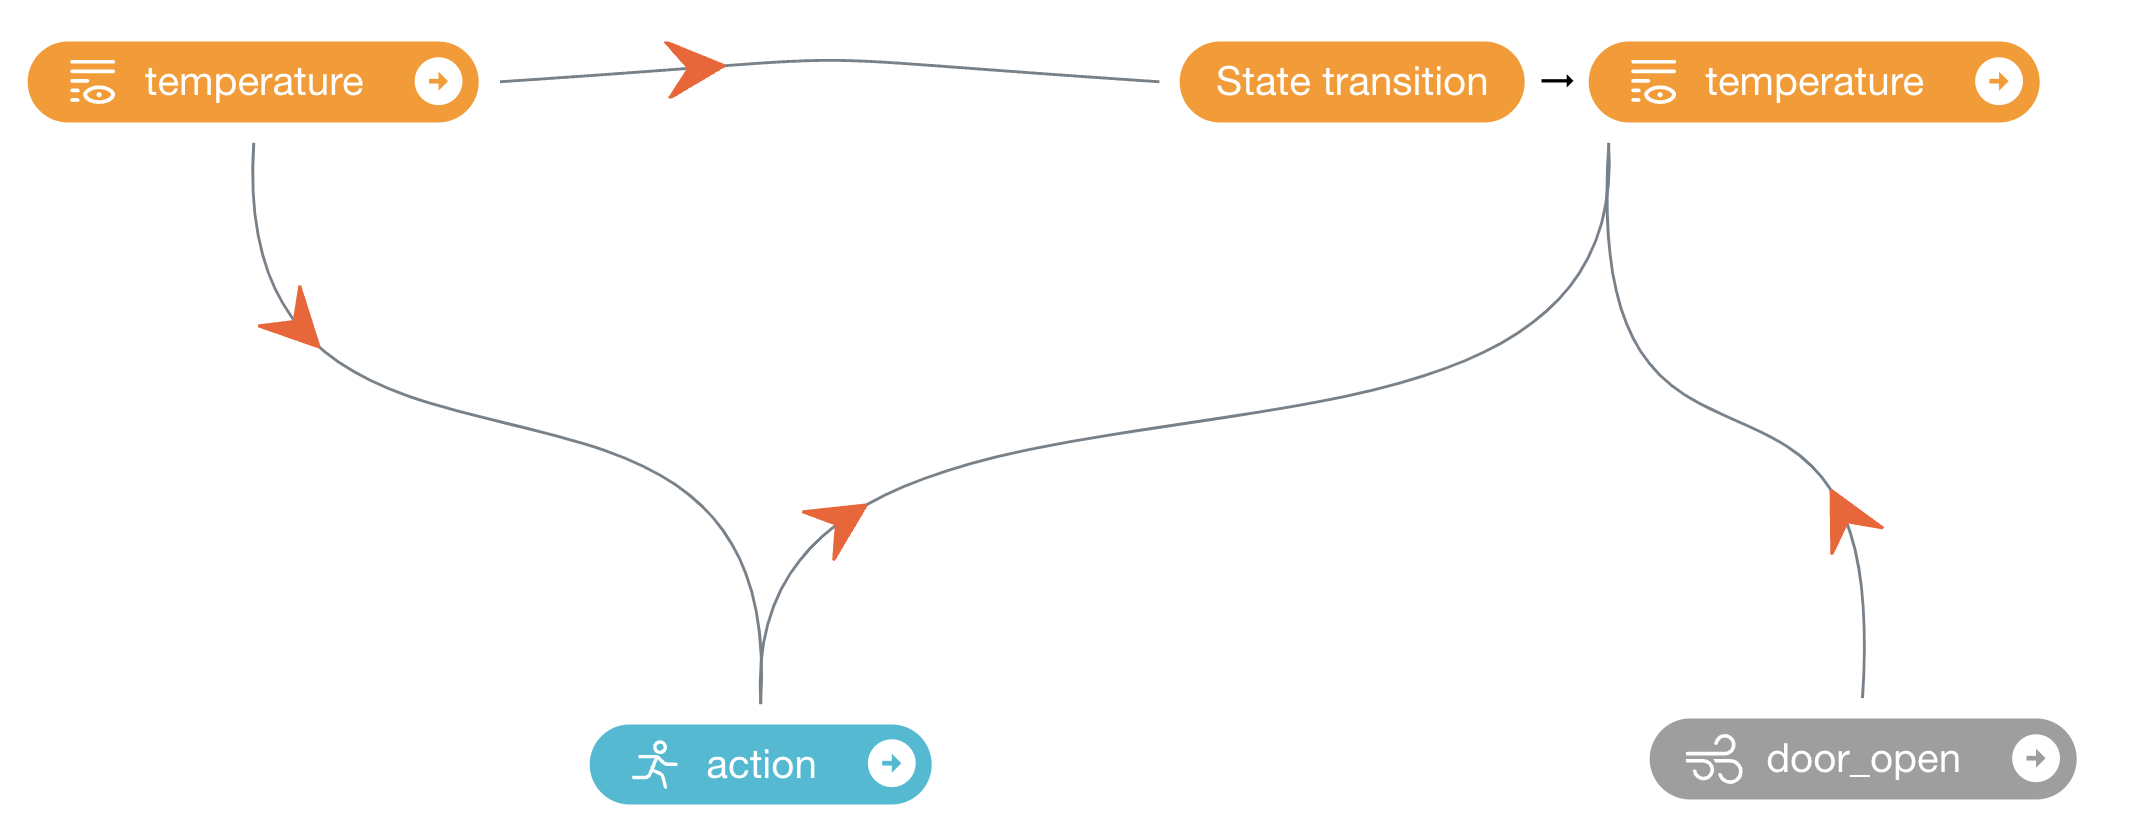
Where the action node is the policy control node, and the input is the temperature node, indicating that the value (power)
of action is determined by the current temperature. door_open is an external variable and serves as the input
of next_temperature node, representing its ability to affect the change of the temperature inside the refrigerator at
the next moment but will not be affected by other nodes in the chart. action, temperature , and door_open are all
inputs of the next_temperature node, indicating that these three nodes collectively affect the temperature inside the
refrigerator at the next moment. The decision flow chart described in the .yaml file above conforms to the scenario logic
of the refrigerator temperature control system.
This decision flowchart corresponds to the .yaml file as shown below:
metadata:
   graph:
     action:
     - temperature
     next_temperature:
     - action
     - temperature
     - door_open

   columns:
     - obs_temp:
         dim: temperature
         type: continuous
         max: 20
         min: -20
     - power_action:
         dim: action
         type: continuous
         max: 10
         min: 0
     - factor_door_state:
         dim: door_open
         type: continuous
During the process of preparing the decision flowchart, we also convert the raw data into a .npz file for storage.
For more detailed descriptions on defining the decision flowchart and preparing the data, please refer to the documentation in the Data Preparation section.
Defining the Reward Function
The design of a reward function is crucial for learning policy. A good reward function should guide the policy to learn in the expected direction. REVIVE SDK supports defining reward functions as python source files.
To obtain a better refrigeration control strategy, we can define a reward function to measure the temperature control effect (filename: refrigeration_reward.py), which calculates the reward value based on the difference between the current temperature and the target temperature, with smaller differences resulting in higher rewards.The reward function is defined as follows:
import torch
from typing import Dict

def get_reward(data : Dict[str, torch.Tensor]) -> torch.Tensor:
   '''
   data: contains all the node data defined in the decision flowchart.
   return reward
   '''
   target_temperature = -2 # represents the target attitude of the refrigerator
   reward_temperature = - torch.abs(data['next_temperature'][...,0:1] - target_temperature)

   return reward_temperature
The above reward function aims to control the refrigerator to the specified temperature (-2°C).
For more detailed descriptions on defining reward functions, please refer to the documentation in the Reward Function section.
Train a Better Refrigerator Temperature Control Policy
The REVIVE SDK provides the data and reward function files mentioned above. For more details, please refer to the REVIVE SDK source code repository https://agit.ai/Polixir/revive/src/branch/master/examples/task/Refrigerator.
After completing the installation of the REVIVE SDK, switch to the examples/task/Refrigerator directory and run the following
Bash command to start training the virtual environment model and policy model. During the training process, we can use tensorboard
to monitor the training process by opening the log directory at any time. When the REVIVE SDK completes training the virtual
environment model and policy model, we can find the saved models ( .pkl or .onnx ) in the log folder ( logs/<run_id> ).
Testing the Trained Policy Model
Finally, we need to use our trained model to control the refrigerator. Here, we provide an example of testing the model on the refrigerator environment. For more information on using a trained model or policy, please see: Using a Trained Model.
import os
import pickle
import numpy as np

# Get the path of the model file
policy_model_path = os.path.join(os.path.dirname(os.path.abspath(__file__)),"logs/run_id","policy.pkl")

# Load the model file
policy_model = pickle.load(open(policy_model_path, 'rb'), encoding='utf-8')

# Randomly generate state information
state = {'temperature': np.random.rand(2, 1)}
print("Model input state:", state)

# Use the policy model for inference
action = policy_model.infer(state)
print("Model output action:", action)
Alternatively, you can directly use the notebook script provided by the REVIVE SDK to test the control effect of the policy. For more information, please refer to refrigerator.ipynb.