Example of applying REVIVE to gym-pendulum

Inverted pendulum balancing task description
Gym-Pendulum is one of the classic control problems in traditional Reinforcement Learning (RL) field. As shown in the animation above, one end of the pendulum is connected to a fixed point and the other end can swing freely. The objective of this control problem is to apply torque to the free end of the pendulum, so that the pendulum eventually stabilizes and balances upside down on the fixed point. In this position, the pendulum can “stand” on the fixed point and maintain balance. A specific description of this problem can also be found at Gym-Pendulum. In this example, we try to illustrate how to build the virtual environment of Gym-Pendulum using the REVIVE SDK and learn the optimal control strategy based on the virtual environment. We also compare the performance of the policy output by the REVIVE SDK with the policy based on historical data. We will intuitively feel and understand the operation mechanism and training effect of the REVIVE SDK.
Action Space |
Continuous(1) |
Observation |
Shape (3,) |
Observation |
High [1. 1. 8.] |
Observation |
Low [-1. -1. -8.] |
Action Space
Apply torque to the free end of the pendulum, where the magnitude of the torque is continuous and distributed in the space of [-2,2].
Observation Space
The observation space is three-dimensional, representing the sine value, cosine value, and angular velocity change value of the angle between the pendulum and the gravity direction.
Inverted Objective
In the Gym-Pendulum task, we attempt to apply torque to one end of the pendulum to make it balance upside down on the fixed point. The reward function is determined by the following equation:
where the maximum and minimum values of the equation are 0 and -16, respectively, corresponding to the pendulum standing upright on the fixed point or inverted.
import torch
import math

def get_reward(data : Dict[str, torch.Tensor]) -> torch.Tensor:
   action = data['actions'][...,0:1]
   u = torch.clamp(action, -2, 2)

   state = data['states'][...,0:3]
   costheta = state[:,0].view(-1,1)
   sintheta = state[:, 1].view(-1,1)
   thdot = state[:, 2].view(-1,1)

   x = torch.acos(costheta)
   theta = ((x + math.pi) % (2 * math.pi)) - math.pi
   costs = theta ** 2 + 0.1 * thdot**2 + 0.001 * (u**2)

   return -costs
Initial State
The pendulum can have any initial angle and speed as its initial state.
Training Control Strategy with REVIVE SDK
REVIVE SDK is a historical data-driven tool. According to the documentation tutorial section, using REVIVE SDK on the task can be divided into the following steps:
Collect historical decision-making data for the task;
Combine business scenarios and collected historical data to construct decision flow charts and array data; the decision flow chart mainly describes the interaction logic of business data and is stored in a
.yamlfile, while the array data stores the node data defined in the decision flow chart, which is stored in a.npzor.h5file.With the above decision flow chart and array data, REVIVE SDK can already train the virtual environment model. However, to obtain a better control strategy, a reward function must be defined based on the task objective. The reward function defines the optimization objective of the policy and can guide the control strategy to better control the pendulum standing at the solid position.
After defining the decision flow chart, training data, and reward function, we can use REVIVE SDK to start training the virtual environment model and policy model.
Finally, the policy model trained by REVIVE SDK can be tested online.
Collect Historical Data
In this example, we assume that there is an existing pole control strategy (referred to as the “original strategy” below), and our goal is to train a new strategy that is better than this strategy using REVIVE. We first use this original strategy to collect historical decision-making data.
Define Decision Flow Chart and Prepare Data
Once historical decision data is available, the decision flow chart must be constructed based on the business scenario.
The decision flow chart accurately defines the causal relationship between data.
In the pendulum control task, we can observe the state information of the pendulum (states).
The state is a three-dimensional quantity representing the sine value, cosine value, and angular velocity change value of the angle between the pendulum and the gravity direction.
The control strategy (actions) applies torque to one end of the pendulum based on the information in the states.
The following example shows the details of the “.yaml” file. Typically, the “.yaml” file consists of two parts: “graph” and “columns”. The “graph” section defines the decision flow chart. The “columns” section defines the composition of the data. See Preparing Data for more details. Note that since “states” has three dimensions, the columns of “states” should be defined in order within the “columns” section. As shown in gym-pendulum, the variables in the state and action are continuous distributions, and we use “continuous” to describe each column of data.
metadata:

   graph:                <- 'graph' section
     actions:            <- corresponds to `actions` in `.npz`.
       - states          <- corresponds to `states` in `.npz`.
     next_states:
       - states          <- corresponds to `states` in `.npz`.
       - actions         <- corresponds to `actions` in `.npz`.

   columns:              <- 'columns' section
     - obs_0:               ---+
       dim: states             |
       type: continuous        |
     - obs_1:                  |    Here, 'dim:states' corresponds to 'states' in `.npz`.
       dim: states             | <- 'obs_*' means the *-th dimension of 'states'.
       type: continuous        |
     - obs_2                   |
       dim: states             |    Since 'states' has three dimensions, we define it
       type: continuous     ---+     in 'columns' according to the order of dimensions.
     - action:
       dim: actions
       type: continuous
Convert the data into an .npz file and store it during the preparation of .npz files according to Preparing Data.
Define Reward Function
The design of the reward function is crucial for learning the policy. A good reward function should guide the policy to learn in the expected direction. REVIVE SDK supports defining reward functions in Python source files.
The goal of the inverted pendulum is to balance the pole upside down on the fixed point, where the angle between the pole and the opposite direction of gravity is 0 degrees, and obtain the highest reward value of 0. When the pendulum hangs vertically at the fixed point, the angle reaches the maximum value of 180 degrees, and the minimum reward value of -16 is obtained.
where the maximum and minimum values of the equation are 0 and -16, respectively, corresponding to the pendulum standing upright on the fixed point or inverted.
import torch
import math

def get_reward(data : Dict[str, torch.Tensor]) -> torch.Tensor:
   action = data['actions'][...,0:1]
   u = torch.clamp(action, -2, 2)

   state = data['states'][...,0:3]
   costheta = state[:,0].view(-1,1)
   sintheta = state[:, 1].view(-1,1)
   thdot = state[:, 2].view(-1,1)

   x = torch.acos(costheta)
   theta = ((x + math.pi) % (2 * math.pi)) - math.pi
   costs = theta ** 2 + 0.1 * thdot**2 + 0.001 * (u**2)

   return -costs
For more detailed descriptions of the reward function, see Reward Function.
Training control policies using REVIVE SDK
We have constructed all the necessary files to run the REVIVE SDK, including a .npz data file,
a .yaml file, and a reward.py reward function, all located in the data folder. There is also
another file config.json which stores hyperparameters for training.
We can start model training with the following command:
python train.py -df data/expert_data.npz -cf data/Env-GAIL-pendulum.yaml -rf data/pendulum-reward.py -rcf data/config.json -vm once -pm once --run_id pendulum-v1 --revive_epoch 1000 --ppo_epoch 5000 --venv_rollout_horizon 50 --ppo_rollout_horizon 50
More details on training models can be found in the documentation under Preparing Data.
Note that the REVIVE SDK provides code and data to support one-click operation. The data and code are available in the SDK source code library.
Testing policy models on Gym-Pendulum tasks
Finally, we obtain the control policy trained by the REVIVE SDK from the log file, which is saved at
logs\pendulum-v1\policy.pkl. We attempt to test the effect of the policy on the Gym-Pendulum environment
and compare it with the original control effect in the data. In the following test code, we randomly test
the policy 50 times on the Gym-Pendulum environment, each time running 300 timesteps, and finally output
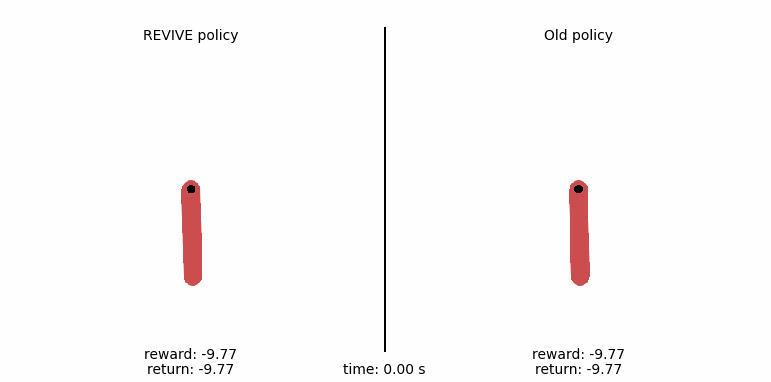
the average return (cumulative reward) of these 50 tests. The policy obtained by the REVIVE SDK has an average
reward of -137.66, far higher than the original policy’s reward value of -861.74 in the data, with a control
effect improvement of about 84%.
import warnings
warnings.filterwarnings('ignore')

from Results import get_results
import pickle

result = get_results('logs/pendulum-v1/policy.pkl', 'url/Old_policy.pkl')
r_revive, r_old, vedio_revive, vedio_old = result.roll_out(50, step=300)

with open('url/results.pkl', 'wb') as f:
pickle.dump([vedio_revive, vedio_old], f)

# Output:
# REVIVE Average Return: -137.66
#    Original Average Return: -861.74
For a more intuitive comparison of policies, we generate a control animation of the policy with the following code. In the animation, we show every step of the pendulum motion. From the comparison, the left pendulum swing output by the REVIVE SDK policy can stabilize the pendulum at the balance point within 3 seconds, while the original policy in the data cannot control the pendulum to the target position.
from Video import get_video
from IPython import display
%matplotlib notebook

vedio_revive, vedio_old = pickle.load(open('url/results.pkl', 'rb'))
html = get_video(vedio_revive,vedio_old)
display.display(html)